Skip to content
THE ROUNDUP / 2026 SEASONRESULTS THROUGH OCTOBER 31, 2026
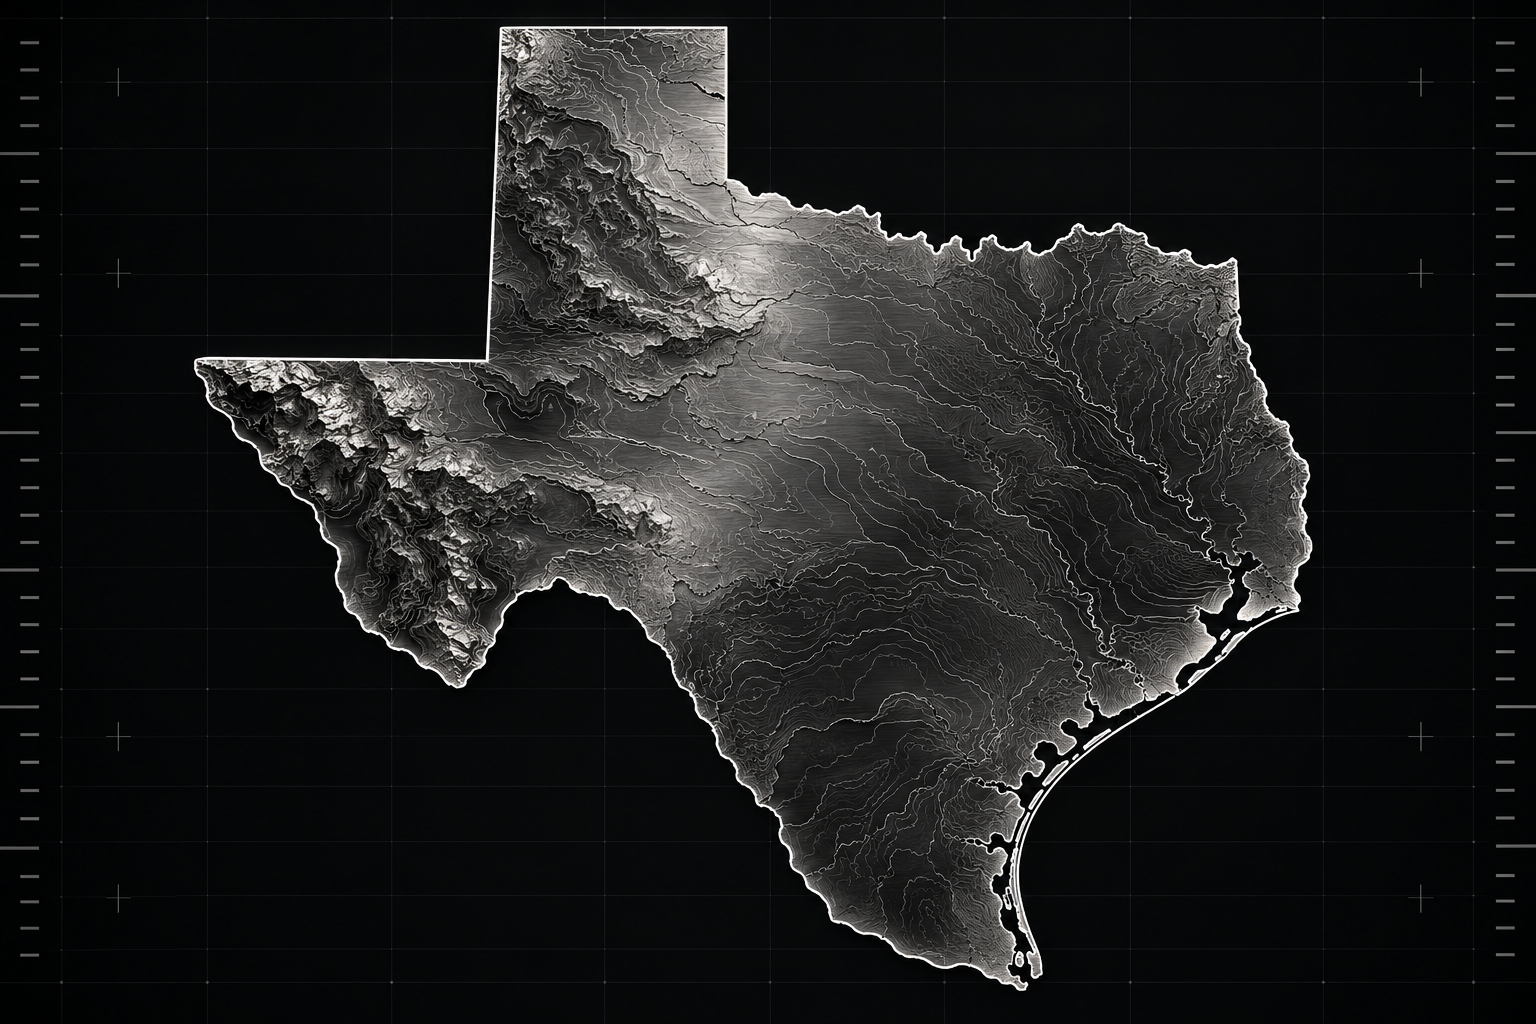
Silver topographic illustration of Texas
HOME TURFSan Antonio, TexasApproximate community location

2026 TEAM PROFILE / Private / Independent

San Antonio Antonian College Preparatory Apaches

TAPPS 11-Man Division 1 – 2 →

3–6Overall recordSTRENGTH OF SCHEDULE70.1/100EASIER50TOUGHER9 of 9 completed opponents includedResults through Oct 31, 2026. Opponents’ winning percentage, excluding games against this team, plus a 20-point base. Capped at 100. Higher means tougher.
1–5District record
7District position
0State titles

No state title in the verified archive through 2025.

2026 HEAD COACHBlaine PedersonSince 2026 1st season at this school
San Antonio Antonian Prep logo

Association field pending

THE SEASON SCHEDULE.

SEASON2026
Date Opponent Site Result
San Antonio Edison Bears Home W 48–6
Austin Regents School Knights Away L 20–56
Houston St. Pius X PanthersDISTRICT GAME Home L 33–40
Tomball Concordia Lutheran CrusadersDISTRICT GAME Away L 35–42
Houston KIPP Sunnyside SenatorsHouston KIPP Sunnyside Home W 58–6
Austin St. Michael’s Catholic Preparatory School WarriorsDISTRICT GAME Home W 44–41
San Antonio Central Catholic ButtonsDISTRICT GAME Away L 15–26
Houston St. Thomas EaglesDISTRICT GAME Home L 28–31
Houston Lutheran South PioneersDISTRICT GAME Away L 7–69

THE SAN ANTONIO ANTONIAN PREP FILE.

LATEST TEAM UPDATE / NOVEMBER 1, 2026

San Antonio Antonian Prep: where things stand

San Antonio Antonian Prep is 3–6 overall in TAPPS 11-Man Division 1 – 2.

The latest reported result was a 7–69 loss to Houston Lutheran South on 2026-10-30.

Based on reported results available through October 31, 2026.

LATEST SAN ANTONIO ANTONIAN PREP STORIES

THE PLAYOFF LOOK.

IF THE SEASON ENDED TODAY / CURRENT STANDINGS

This program is outside the UIL bracket model. An opponent will be listed when its association’s qualifying field and pairings are verified.

Results through October 31, 2026. W = winner; R = runner-up; T = third; F = fourth. In 6A, the two largest schools by enrollment among each district’s four current qualifiers enter Division I; the other two enter Division II. Remaining games and official district tiebreakers can change the field.

View district standings →

2016–2025 / COMPLETED SEASONS

TEN YEARS. THE FULL PICTURE.

SEASON RECORDS ↓
TEN-SEASON RECORD71–39

64.5% winning percentage

All ten completed seasons, including playoffs.

WINNING PERCENTAGE

TRENDING DOWN-14.4 percentage points · 2016 to 2025
20257–558.3% wins
Red at low winning percentages, yellow in the middle, green at high winning percentages, with smooth transitions. Missing seasons leave gaps. Tap the chart or use left and right arrow keys to select a season.0%25%50%75%100%2016201720182019202020212022202320242025
0%30%70%100%

Tap or focus a season for its record. Missing seasons leave gaps. Ties count as half a win.

SEASON BY SEASON 10/10 VERIFIED
SEASONRECORDWIN %POSTSEASON FINISH
20257–558.3%Not yet verified
20248–372.7%Not yet verified
20239–375.0%Not yet verified
20229–281.8%Not yet verified
20216–554.5%Not yet verified
20206–275.0%Not yet verified
20199–469.2%Not yet verified
20185–645.5%Not yet verified
20174–640.0%Not yet verified
20168–372.7%Not yet verified

Postseason shows the furthest round reached, not rounds won. Round names follow the association’s bracket; six-man and private-school formats vary. Unverified finishes are left open.